
Product marketing metrics are crucial for companies and teams to measure their performance and progress towards their goals. They help you figure out whether you’re on the right track, what’s working well, and where you might need to make some changes to improve your approach.
Some product marketing metrics and KPIs include win/loss ratio, conversation rates, and onboarding data, so check out what you should be measuring! 👇
- Micro and macro goals
- What is product success in developer marketing?
- Product success metrics in dev marketing
- What are product marketing metrics?
- 13 product marketing metrics you should track
Micro and macro goals
If you’re launching a new marketing campaign, you must set micro and macro goals. That way, you can figure out which goals you need to focus on first and which ones are more like bonuses.
For instance, you might set a goal to get a certain number of likes or comments on social media (think LinkedIn, Twitter, YouTube, Facebook, etc.). This is a smaller goal that’ll help you achieve the bigger goals that your company’s set, such as gaining new customers or getting more developers to buy your product.
Setting goals like this will ultimately help you to track important metrics in your business, like conversion rates, growth rates, customer churn, customer acquisition, market share, and more.
You’ll have more tangible results to show for all the hard work you’ve put into your marketing efforts. And, when you can show you’re making progress towards your goals, it’ll encourage your team and your stakeholders to keep working together to improve your marketing strategies.
 Teresa Garanhel
What is product success in developer marketing?
Product success refers to achieving your desired outcomes for a product aimed at developers. These outcomes could be related to user adoption, engagement, revenue, and other metrics or KPIs.
In developer marketing, product success is often measured by how well the product meets the needs of developers and how effectively it addresses their pain points. Things like strong documentation, user-friendly APIs, responsive customer support (and developer experience), can help make the developer’s job easier.
Something else to consider is that product success is tied to the overall success of the developer ecosystem. A successful product will not only benefit the developers who use it, but also help to build a thriving developer community around it – which can lead to greater innovation, collaboration, and growth.
Product success metrics in dev marketing
Here are a few product success metrics to help you evaluate how successful your product really is:
- Go-to-market initiatives – this can include win rates, conversion rates, and analyst reports.
- Sales enablement – which includes asset utilization, deal cycles, and win/loss ratio.
- Marketing support – such as site traffic, campaign performance, and MQLs and SQLs (Marketing Qualified Leads and Sales Qualified Leads, respectively).
- Product adoption – like onboarding data, feature adoption, and churn rates.
- User adoption – which you can track via number of downloads or product sign-ups.
- Engagement – the level of engagement users have with your product can be measured by the amount of time spent on it, the frequency of use, and the number of actions taken within the product.
To measure the success of your product, define clear goals and metrics before launching it, and then track them over time. Otherwise, it’d be impossible for you to tell whether the product’s meeting the needs of your developer audience.
Teresa Garanhel
What are product marketing metrics?
When marketing a product, you must have a way to measure how well it’s performing! Product marketing metrics can help with that. There are five main categories of metrics you should pay attention to:
- Leads: they help you see how well your org is doing in the market and can help you find potential customers.
- Revenue: helps you analyze your sales and product revenue so you can figure out how to make more money.
- Conversion: which refers to how often visitors to your website actually end up becoming paying customers.
- Engagement: it measures how often people interact with your product, as mentioned above.
- Traffic: how many people are visiting your site? How are they interacting with it? This can help you see the parts of your website that work well and the ones that need improvement.
13 product marketing metrics you should track
1. Sales effectiveness
This might not be the first KPI that comes to mind when you think about product marketing metrics, but it’s nonetheless important. Sales reps benefit from the assets created by product and developer marketing managers, so it’s critical to keep track of how well they perform.
So, certain sales enablement tools can help you to measure the amount of times these assets are used, and you can also get feedback from your sales team. Ask them which assets help them the most or which doc has helped sway a developer in your favor, for example.
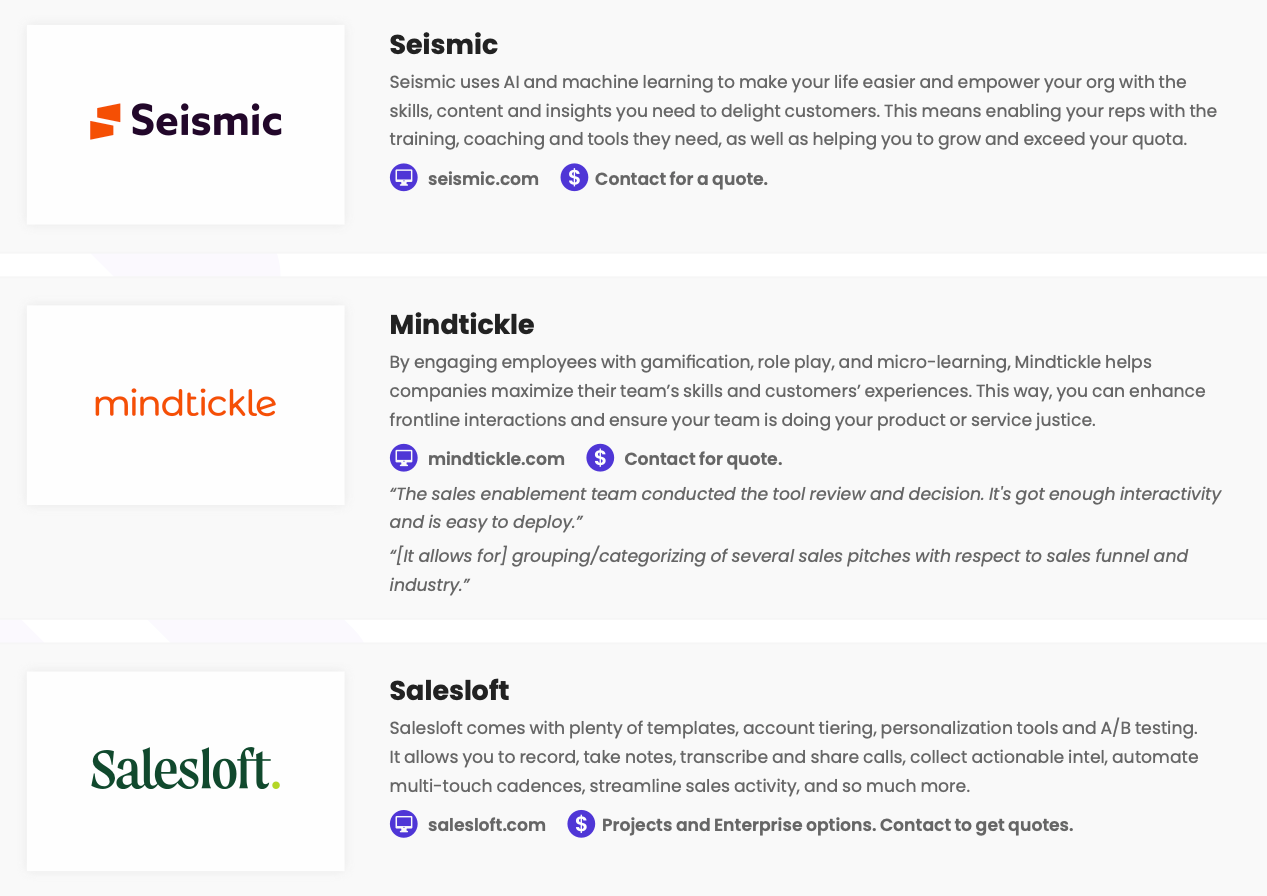
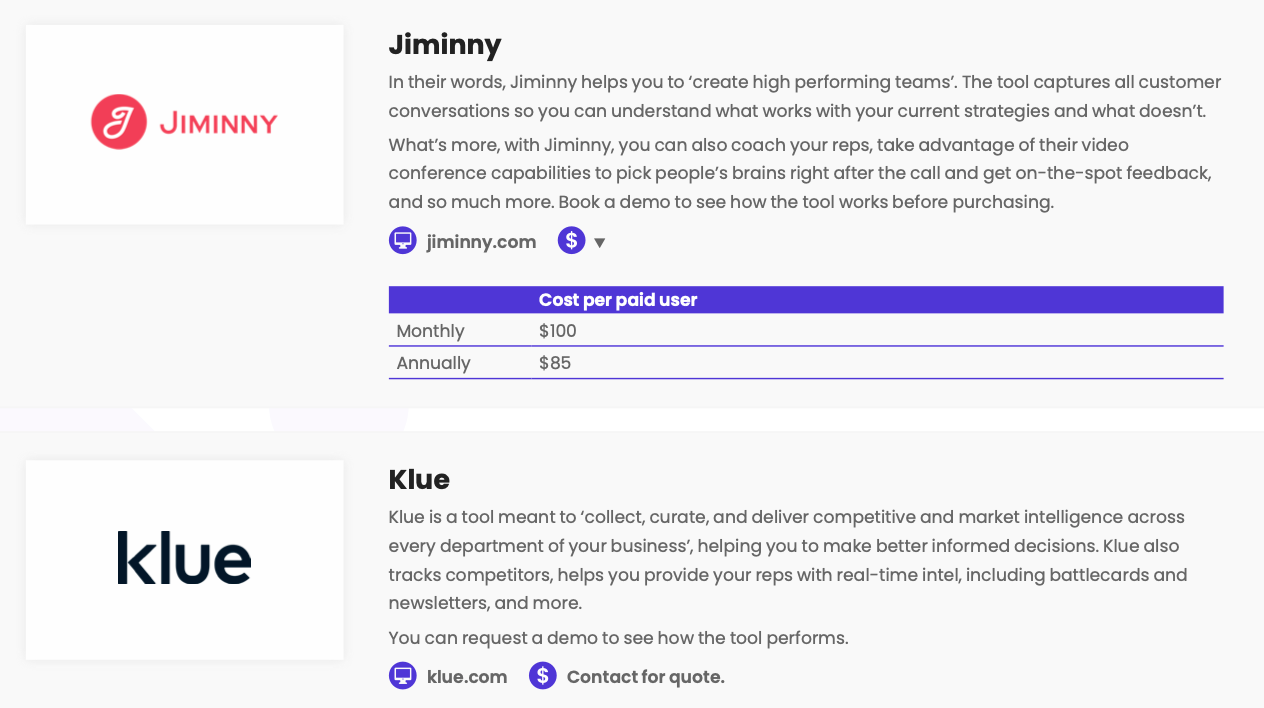
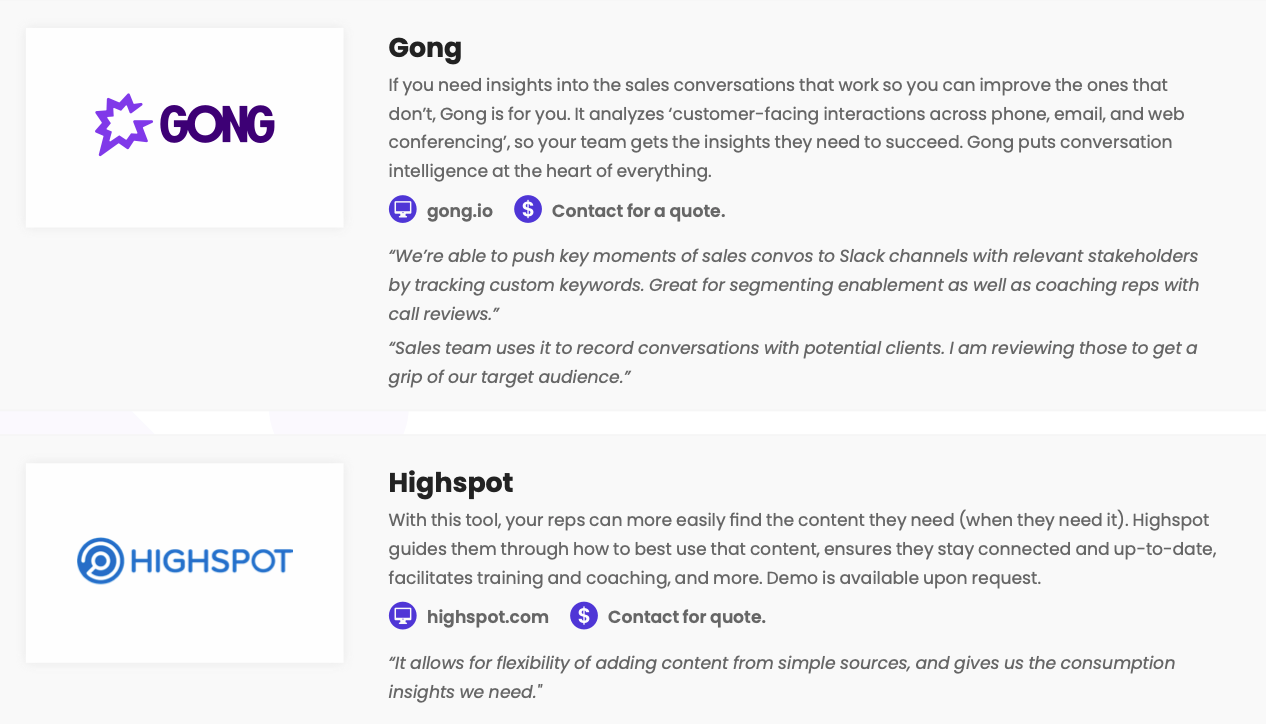
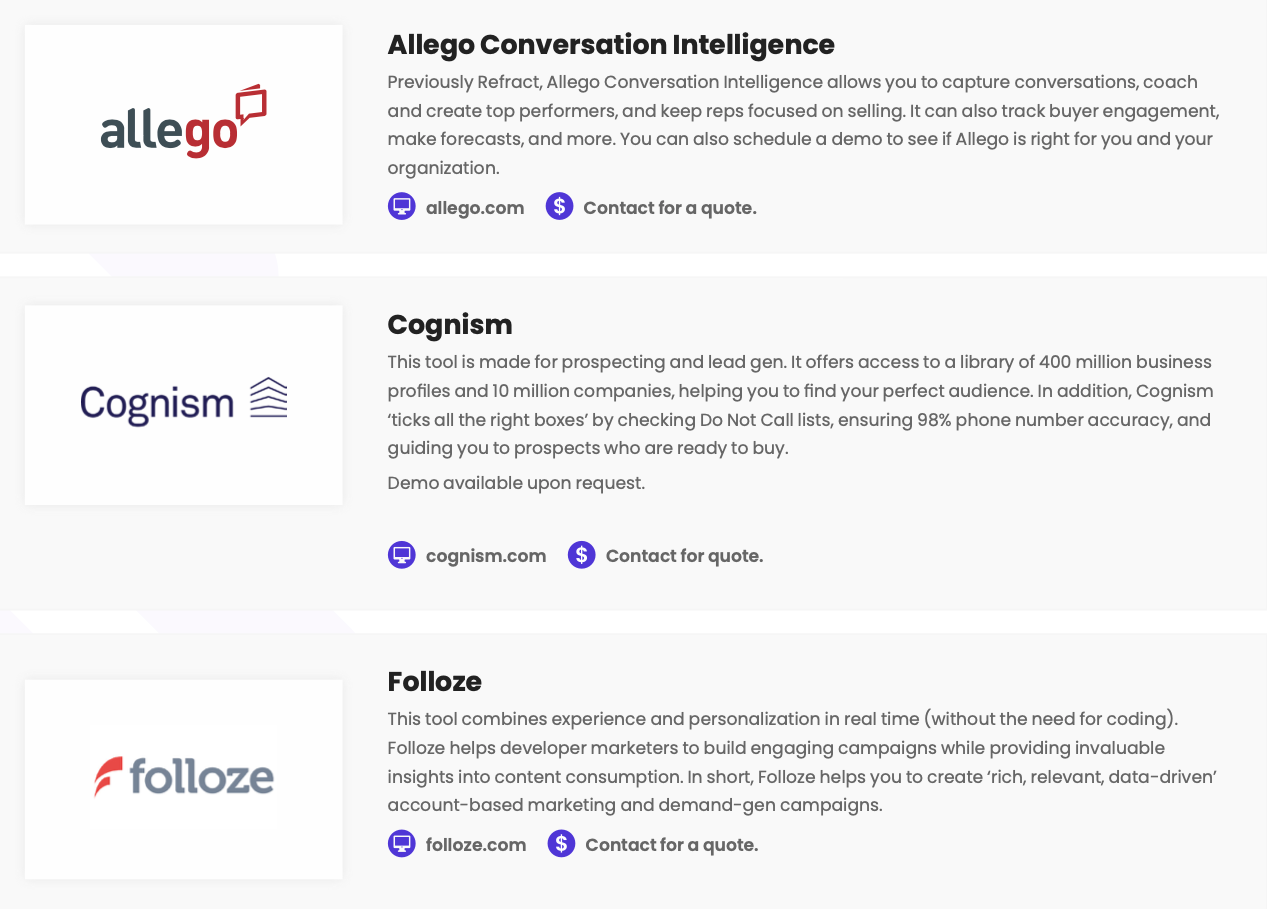
In our Tools of Choice report, we go over a few sales enablement tools handpicked by developer marketers all over the world, including:
2. Brand awareness
As always, brand awareness is a key goal for many businesses, and you can measure it by:
- Conducting surveys to get a sense of how many people are aware of your brand and how well they know it.
- Tracking your social media metrics, such as likes, shares, and mentions, which gives you an idea of how well your brand is resonating with your developer persona and audience.
- Analyzing website traffic for insights into the direct traffic or branded searches you’re getting, which indicates people are familiar with your brand and actively searching for it.
- Monitoring search engine metrics, like search volume and keyword rankings, to get a feel for how often people are searching for your brand and whether they can easily find it.
3. Product adoption
How can you tell if your product is attracting and retaining users? By measuring it with:
- User sign-ups: the number of people signing up for your product. It gives you an idea of how many developers are interested in trying it out.
- Active users: the number of users actively using your product; i.e., developers who find your product useful and continue to use it over time.
- Time spent on the product: the amount of time developers spend in your product, which helps you determine their levels of engagement.
- Referral rate: the number of developers who refer your product to other users. It also helps you to see how happy your customers are with your offering!
- Feedback: if developers are giving user feedback (how they’re using the product, what they like about it, the tweaks they’d love to see, etc.), then it’s fair to say they’re engaged with your product. Additionally, feedback gives you the areas for improvement so you can increase product adoption rates.
Aleksandar Micev
4. Win rates
The win rate is a way to see how many sales your team has successfully closed. It's calculated by taking the total number of closed deals and dividing it by the total number of prospects in the deal stage, whether they ended up being a won deal or not.
This helps you track how well your team is doing at closing deals.
Win rate = Won deals / All deal stage prospects
5. Conversion rates
This measures the number of visitors who complete the desired goal on a website, which can be “making a purchase”. To calculate it, you divide the number of conversions by the total number of visitors to the website.
This helps you understand how effective your website is at converting visitors into customers.
Conversion rate = Number of conversions / Total number of visitors
6. Asset utilization
Asset utilization refers to the efficiency with which a company uses its assets to generate revenue – it measures how well a company is using its resources to create value.
It’s calculated by dividing the revenue generated by the assets used to generate that revenue. A high asset utilization ratio indicates that a company is effectively using its assets to generate revenue, while a low ratio may indicate that the company is not using its assets efficiently.
By monitoring asset utilization, companies can identify areas where they can improve efficiency and maximize their return on investment.
Asset utilization = (Total assets at the beginning of the period + total assets at the end of the period) / 2
7. Deal cycle
A deal cycle refers to the average number of days or months it takes to close a deal. It includes the series of stages that a sales opportunity or deal goes through from the initial contact with a prospect to the final closing.
It typically includes stages such as lead generation, qualification, needs analysis, proposal, negotiation, and closing. The length and complexity of the deal cycle can vary depending on the industry, the size and complexity of the deal, and the sales process of the organization.
Tracking the deal cycle can help sales teams understand where a deal stands in the process and what actions need to be taken to move it forward. This helps to improve the efficiency and effectiveness of the sales process.
Average deal cycle = Total number of days it took to close every single deal / Total number of deals
Developer Marketing Alliance
8. Win/Loss ratio
Win/loss ratio is a metric used to measure the effectiveness of a sales team in closing deals. It compares the number of deals won to the number of deals lost by the sales team over a given period of time.
To calculate the win/loss ratio, the total number of deals won is divided by the total number of deals lost. For example, if a sales team won 20 deals and lost 10 deals, the win/loss ratio would be 2:1 or 66.7%.
The win/loss ratio provides insight into the sales team's performance and can help identify areas for improvement. A high ratio indicates that the team is effective in closing deals, while a low ratio suggests that the team may need additional training or support to improve their performance.
By monitoring this metric, sales managers can make data-driven decisions to improve their sales strategy and increase revenue.
Win/loss ratio = number of won deals / number of lost deals
9. Site traffic
Simply put, site traffic is the number of people being driven to your website. There are many metrics you can use to tell whether site visitors are engaged with your content, including bounce rate, clickthrough rate, engagement rate, etc.).
10. MQLs and SQLs
An MQL is a potential customer that the marketing team thinks would be a good fit for the company and passes on to the sales team as a lead. To measure this, you simply count the total number of MQLs generated in a specific period.
Once the sales team has vetted an MQL and determined they're a good fit, they become an SQL. You would measure this the same way by counting the total number of SQLs generated in the same period.
In short, MQLs are potential customers that the marketing team thinks would be a good fit, and SQLs are potential customers that the sales team has determined are a good fit and are ready to be guided through the rest of the sales process.
11. Onboarding data
How long does it take to complete the developer onboarding process? What’s the customer response rate? And their engagement rate? Answering these questions helps you to measure how successful your onboarding process is!
12. Feature adoption
We already mentioned product adoption, but there are also many different metrics to measure feature adoption, such as the time it takes to adopt it, the depth of adoption, the duration of the adoption, etc.
13. Churn rate
Another metric to keep in mind is churn rate; i.e., how many developers leave your business or stop using your product in any given period. You calculate this by dividing the churned customers by the number of total customers.
Churn rate = Churn customer / Total customers
Check out our podcast for expert content from global developer marketers!
Teresa Garanhel